Hi guys,
This post teach you how to drill down from one dashboard to another dashboard with parameters passing.
Dashboard to Dashboard drill down.
When you click on
"All States" hyperlink on dashboard 1, you have to navigate to second dashboard which displays bar charts with All states.
When you click on particular state you have to navigate to second dashboard which displays that particular state bar chart ..
Dashboard 1:
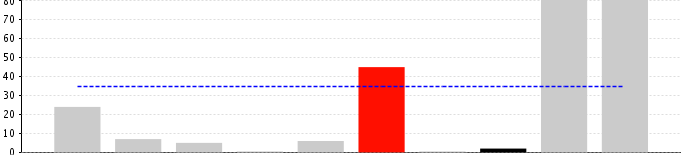
Dashboard 2
Dashboard 2:
In dashboard2 ( You can say it is in Report 2 as you are working with only single report on dashboard).
Lets say you have 1 parameter in 2nd dashboard . say parameter name as "state". Individually in 2nd dashboard when you select a particular state, that state bars should appear on the chart. When you select "All" option from state parameter drop down, you need to list all the bars on chart.
Parameter :
$P{state}
Parameter Query:(
SELECT 'All' AS state
UNION
SELECT DISTINCT state FROM sample_table
ORDER BY state
Report Query:
SELECT
industry_type,
count(company_full_name)
FROM sample_table
WHERE ($P{state}='All' OR state=$P{state})
GROUP BY
industry_type
ORDER BY
industry_type
DESC LIMIT 5
Save your report.. create a dashboard(2nd dashboard) in jasper server..
NOTE:
You should know how to create a parameter in repository and how to publish a report to the server.
Preview and OUTPUT
* See the image two for output.. It is selected with MN state.. displayed all the bars in MN state.
if you select "All" option the dashboard report should display all the bars in states ... also note that I have restricted to limit 5.
Dashboard1
In dashboard 1 you are displaying all the states of USA.. now you want some think like when you click on states it has to go to another dashboard(In this example Dashboard 1).. When you click on " All states" hyper link it'll navigate to the Dashboard 1 and automatically displays the bars of all states.
Report Query:
SELECT state,sum(revenue_of_state) AS revenue
FROM sample_table
GROUP BY
state
ORDER BY state
1) Drag and drop Map component from Palette section to " Title Band" (Summary band is preferrable)
2) Right click on Map component and select Click on " Edit Map Properties"
3) Click on " select a map " button and then select USA(states) from Available Maps.
4) Now click on Map data then " Entites"
5) Click on "Add" give id expression as " $F{state} value expression as "$F{revenue_of_state}".
6) Now, the most important point here you are going to work out.
* Click on Item Hyperlink
* Select " Blank " as Item target
* Select " Reference " as Hyperlink type
* Click on reference tab
* Give the dashboard URL in Hyperlink Reference Expression.
Eg:
"flow.html?_flowId=dashboardRuntimeFlow&dashboardResource=%2FSadakar%2FDashboards%2FIndustry_Wise_Dashboard&hidden_state="+$F{state}
This expression leads you Dashboard2 when you click on states...
7) Now take a text filed and type "All states" give hyperlink to this text filed(Not static text field simply Text field b'z static text field doesn't have hyperlink option)
8) right click ->hyperlink->Hyperlink target: Blank -> Hyperlink type: Reference
9) Hyperlink Reference Expression:
Eg:
"flow.html?_flowId=dashboardRuntimeFlow&dashboardResource=%2FSadakar%2FDashboards%2FIndustry_Wise_Dashboard&
hidden_state=All"
This expression leads you to Dashboard2 when you click on "All states" hyperlink on Dashboard1.
NOTE:
* Copy the URL of Dashboard and edit the URL
* Remove http://localhost:8080/jasperserver-pro/ from URL and pass parameters from the URL.
* Passing Parameters is done with the following syntax :
"URLofDashboardToNavigate&hidden_parameterName="+parameter
* You can add as many parameters as you want by typing
"URLofDashboardToNavigage&hidden_param1Name=parameter1& hidden_param2Name=parameter2
Eg: &hidden_state=All&hidden_measure=revenue"
I believe in " Learning never exhausts the mind"
Sadakar
BI developer